Making Publications
GOWrite 2 is great tool for creating GO diagrams for various types of publication, including books, PDF files, WWW pages and other online media. This chapter explains technical issues in creating publications.
Two main categories can be recognized: purely online material (WWW pages, Wiki pages) and material also suited for printing (books, PDF files). Technical aspects of these are quite different, so separated chapters are written about making material for printing and making online material.
For information how to use GOWrite to edit and comment games, see help on editing and in particular help on variations and help on diagram use.
Actual writing and typesetting can be arranged in many ways. Good practices and ideas are documented in additional help.
Creating Diagrams
Once variations have been added to game, it is time to add diagrams. This can be quiskly started with File->Print & Export Wizard. This wizard uses heuristics to create diagrams as typically needed.
After initial diagrams are created using wizard, they can be adjusted in multiple ways.
Diagrams define always start of diagram.So diagram put after move 100 includes moves 101 and up, until next diagram.
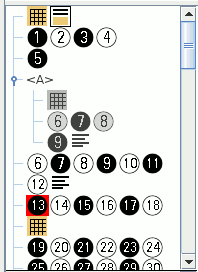 It is helpful to to look at gametree
(in GOWrite main window) in order to understand diagrams. Gametree shows diagrams in
game. Example gametree shown right contains 3 diagrams. First diagram shows moves 1-18.
Second diagram contains variation for move 5, this diagram shows moves 6-9. Third diagram
contains moves starting from 19.
It is helpful to to look at gametree
(in GOWrite main window) in order to understand diagrams. Gametree shows diagrams in
game. Example gametree shown right contains 3 diagrams. First diagram shows moves 1-18.
Second diagram contains variation for move 5, this diagram shows moves 6-9. Third diagram
contains moves starting from 19.
Typically game starts with diagram.This diagram incudes moves starting from first move, often up to move 50 or 100.
Another diagram is at the start of variation. Often variation diagram shows only part of board.
Additional diagrams can be used to split game into multiple diagrams. Usually diagram contains 100 or less moves.
Graphics Workflow
In most cases GOWrite should be used to create graphics needed and some publishing tool (such as QuarkXPressTM or Scribus) or word processor (such as Microsoft(r) Word) should be used to produce final result. GOWrite does not try to offer tools for making publication layouts, but it produces excellent graphics for use in publishing tools.
Two main approaches give efficient workflow: Clipboard (copy and paste) and Export (export all diagrams in file).
It is easy to start with clipboard. However if making long book with lots of diagrams, it may be worthwhile to learn how to use exporting in the beginning.
GOWrite can produce graphics in various formats. When selecting format, please consider its support in all tools used, as tools may have surprising limitations.
Clipboard
Clipboard works with bitmap formats (all platforms) and with Windows Metafile (WMF) in Windows.
Clipboard pros
- Use of clipboard is easy way to start, as it makes leaning easy.
- Allows fast experimentation with diagrams.
Clipboard cons
- If diagrams must be re-created later on, clipboard is clumsy.
- Use of clipboard is restricted by supported platforms and supported formats.
Export all diagrams in file
Command export -> all diagrams, creates all diagrams in SGF file. Depending on format, each diagram may be own file, or all diagrams may be included in one file.
With SVG and ODG (OpenDocument) formats all diagrams can be exported to just one file. This may avoid opening each diagram one by one in layout program making work faster.
Exporting pros
- Exporting all diagrams at once can be very effective, when work set up is done at start.
- Exporting ensures that all diagrams are easy to re-create if needed for any reason.
- Exporting all diagrams is not limited by platform or format.
Exporting cons
- Use of exporting requires bit more planning, set up and thus also learning.
- If word processor cannot detect and refresh changes graphics files, updating must be manually handled.